As we've been reporting, Colorado is grappling with a child poverty problem. Today, a new report offers a clear look at a wide variety of measures -- like teen pregnancies, food stamp use, and more -- that help inform government leaders and the public about the issue.
The annual Kids Count report from the Colorado Children's Campaign sifts through data from the U.S. Census Bureau, the state government, and other sources. Here are 12 charts and maps from it that offer an encyclopedic look at the issue.
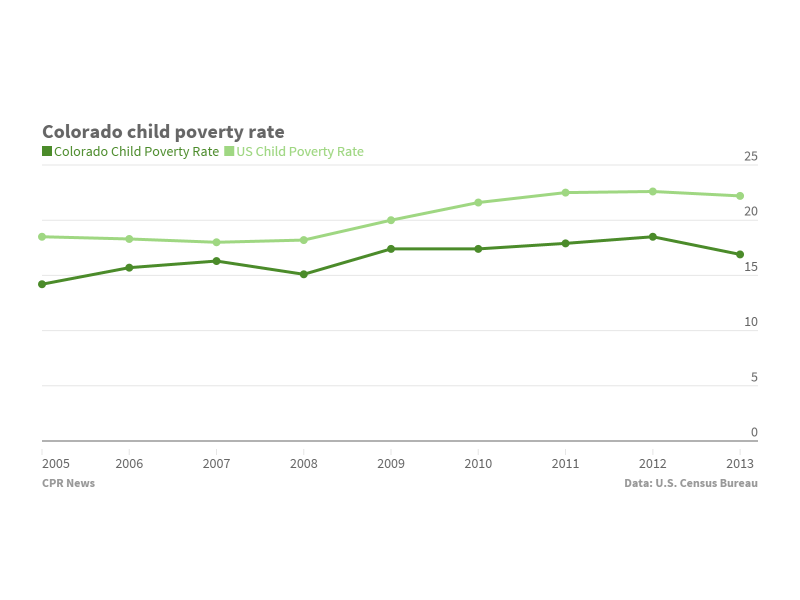
1) The child poverty rate is sliding downward
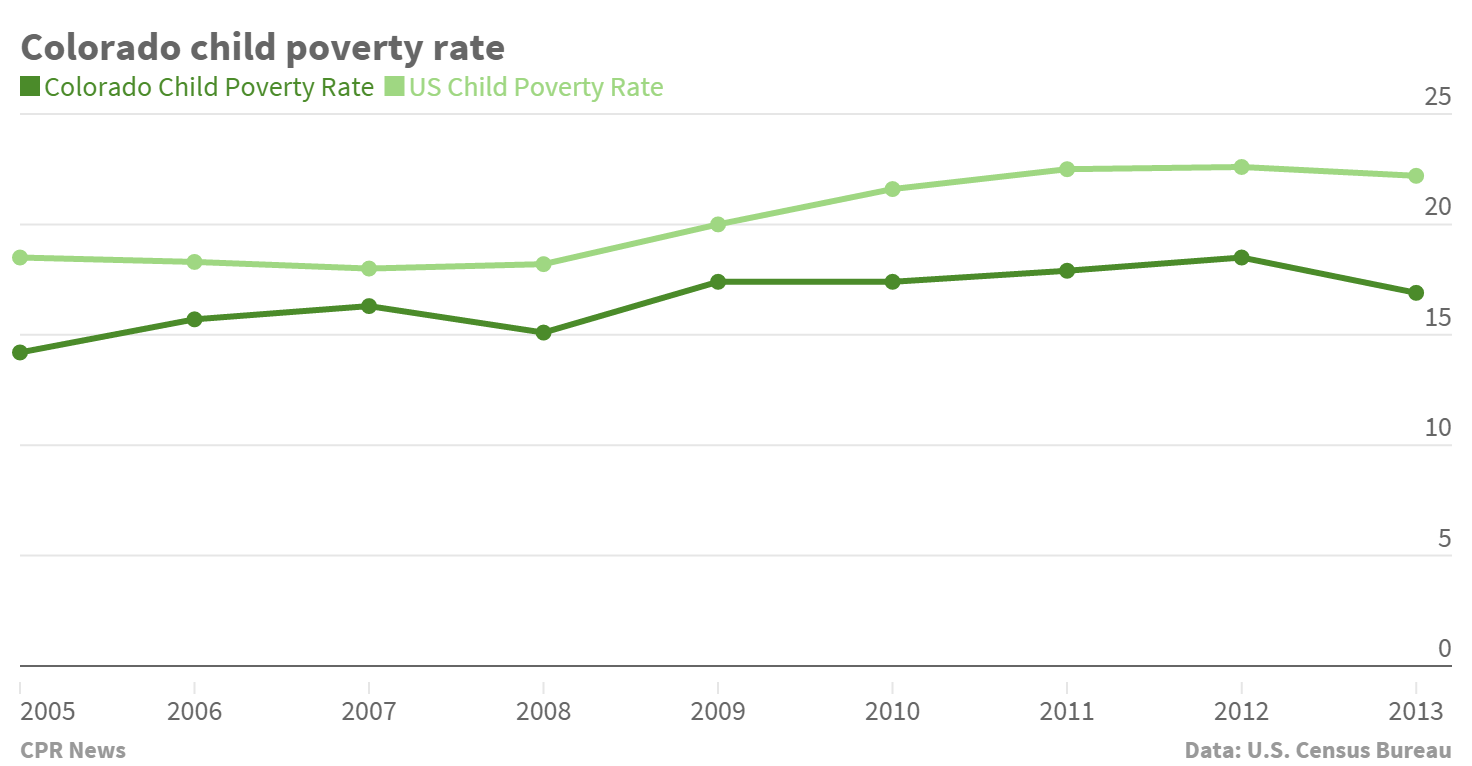
This is the key number. We reported last year the state's child poverty rate dipped slightly in 2013. However, as the Kids Count report notes, it's still well above pre-recession levels:
Between 2000 and 2007, the percent of children living in poverty in Colorado soared from 10 percent to 16 percent—an increase of more than 100,000 children. During that time period, child poverty grew faster in Colorado than in any other state in the nation. While the
increase in child poverty has slowed since 2007, nearly twice as many Colorado children lived in poverty in 2013 as in 2000. Thousands of Colorado families have yet to feel the effects of the economic recovery as the child poverty rate remains above its pre-recession levels.
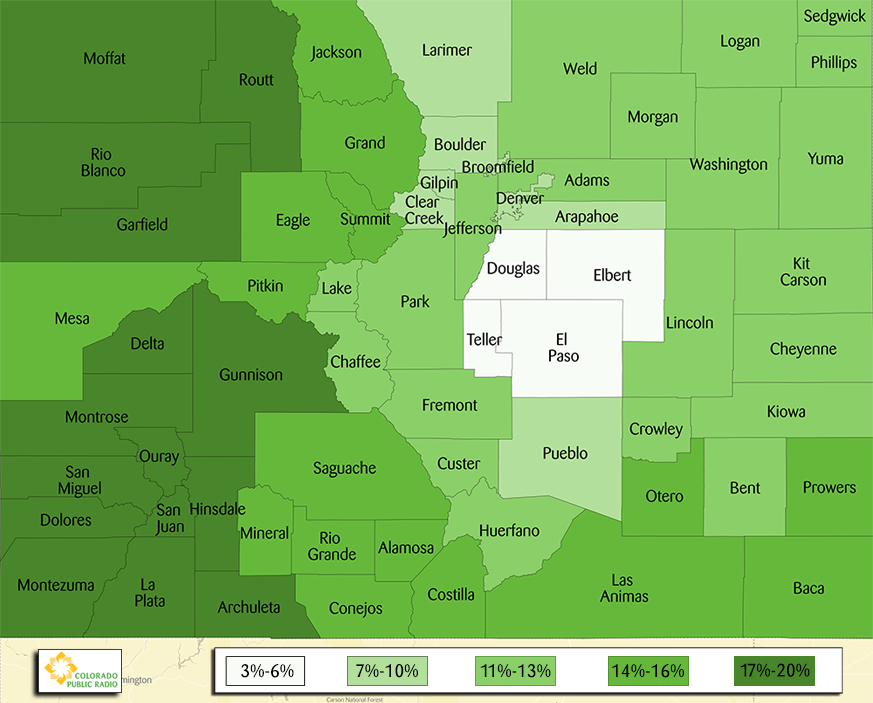
2) But it varies by county. A lot.

The above map shows that the child poverty rate varies widely by county. The state's highest child poverty rates have historically been in the San Luis Valley and the southeastern plains, the Kids Count report notes:
Three counties in the San Luis Valley (Alamosa, Costilla and Saguache counties) are considered “persistently poor” counties. These counties have had at least 20 percent of their overall population living in poverty during the past 30 years, as measured by the 1980, 1990 and 2000 decennial censuses and the 2007-2011 American Community Survey. Poverty that persists through generations presents unique challenges for a community, not only because of the decades of economic hardship but also due to the fact that persistently poor counties are often geographically isolated from other resources.
3) The well-being index
One interesting indicator in the report is the child well-being index. The report's authors chose 12 key indicators for the index, including teen birth rate, uninsured rate, the child poverty rate, the high school drop out rate, and more. Here are the 10 counties that ranked best on the index:
| County | Rank | Change from 2014 |
|---|---|---|
Douglas | 1 | ---- |
| Elbert | 2 | ---- |
| Broomfield | 3 | ---- |
| Boulder | 4 | ---- |
| Larimer | 5 | ---- |
| Jefferson | 6 | ---- |
| Routt | 7 | Up 1 |
| El Paso | 8 | Up 2 |
| Summit | 9 | Up 4 |
| Teller | 10 | Down 3 |
4) Colorado is becoming more diverse

Colorado non-white child population grew from 34 percent in 2000 to 43 percent in 2013.
5) Rural, suburban and urban poverty
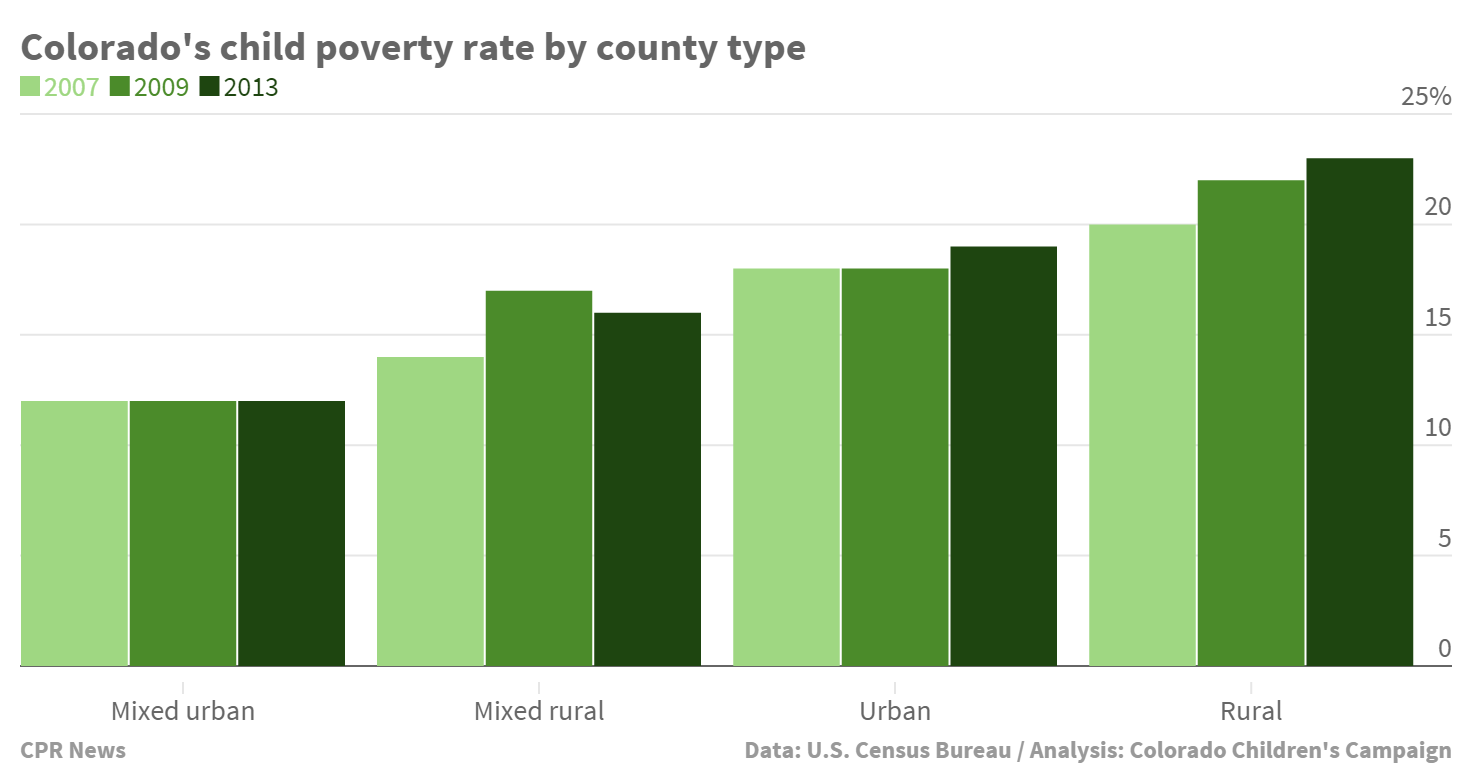
Poverty rates are highest in rural counties. The Kids Count report says this illustrates the slower pace of the economic recovery in many rural areas.
Overall, the state of Colorado has exceeded its pre-recession peak level of employment, but only four of Colorado’s 42 rural counties (Conejos, Costilla, Lake and Phillips) and three of the state’s mixed rural counties (Larimer, El Paso and Weld) had reached this milestone as of 2013.
6) Big jump in concentrated poverty

Kids who live in high-poverty communities are isolated from resources that may help them succeed, the Kids Count report says. Schools are generally lower performing; employers pay less; and even playing outside can be dangerous due to neighborhood crime.
As a result of these disadvantages, children living in high-poverty communities are more likely to suffer from harmful levels of stress and behavioral or emotional problems, even if their families have incomes well above the official poverty line.
7) The teen birth rate is in free fall
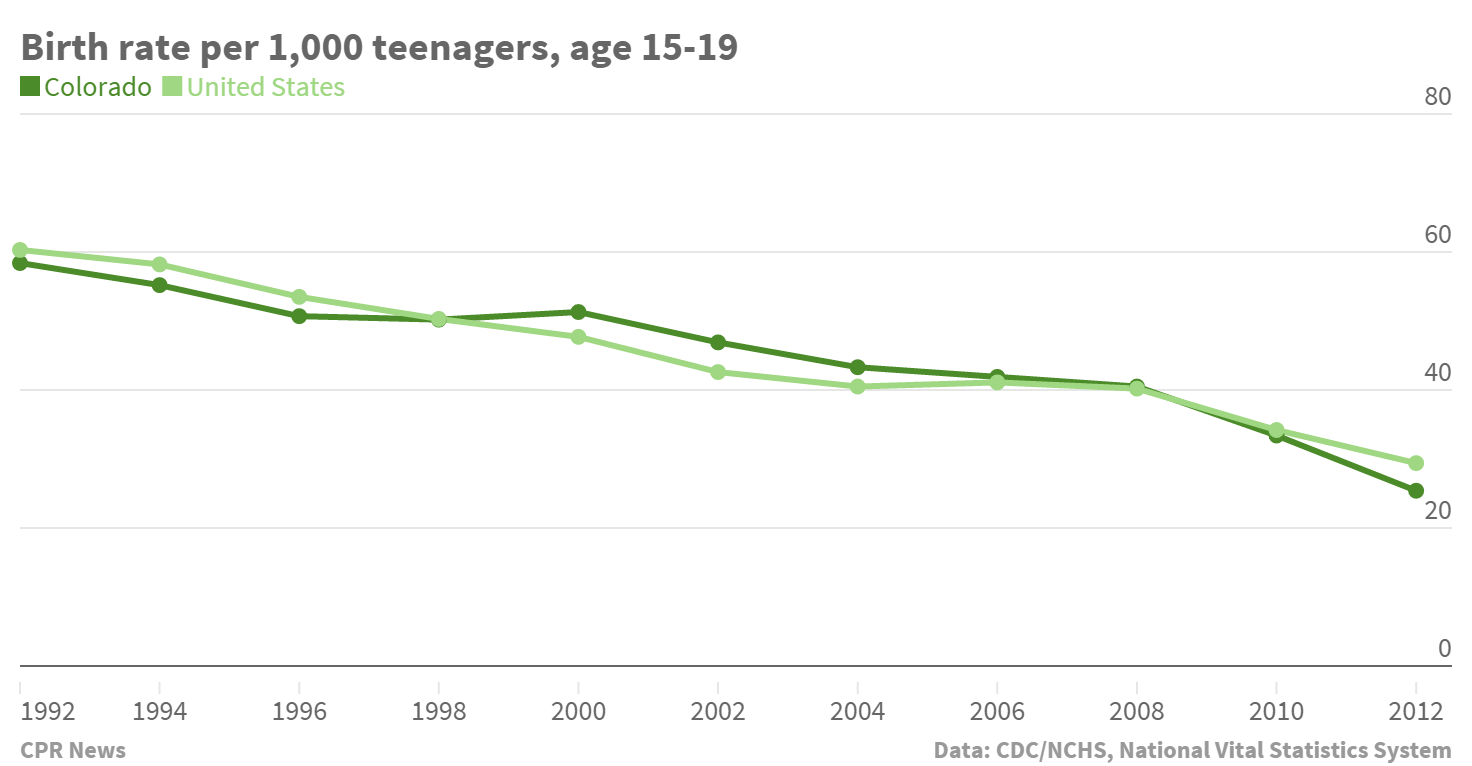
Accidental pregnancies can have a big impact on teens' lives, the Kids Count report says.
Becoming a teen parent is one of the most common reasons girls drop out of high school. Nationally, nearly a third of teen girls who dropped out of high school cited pregnancy or parenthood as one of their primary reasons for leaving. Once they leave school, teen mothers often do not return.
CPR News' Megan Verlee has been reporting on the decline in Colorado's teen pregnancy rate, and the challenges teen mothers face.
8) Uninsured rates vary by county
While insurance coverage rates are rising across the state, there's still major variation depending on where you are. The Kids Count report also notes that finding care once you have coverage can be a challenge.
Especially in rural areas, a shortage of providers who accept a child’s insurance or a shortage of providers in general can impact children’s access to care. A survey conducted by the Colorado Health Institute found that rural areas are home to a sixth of Colorado’s population, but only one-tenth of the state’s physicians.
Next year, the report's authors expect to see the rates to fall again as the effects of the Affordable Care Act are accounted for.
9) One in five children receive food stamps

About 20 percent of Colorado children received SNAP benefits (formerly known as food stamps) in a given month last year.
10) School readiness is determined early

Not all children begin kindergarten on equal footing, as this U.S.-level data shows.
A child’s readiness for school is shaped by their early experiences: the number of words they heard, their access to a high-quality preschool program and the presence of a nurturing parent or caregiver, among other factors. Children who enter school with fundamental skills such as being able to identify sounds or words or listen to instructions from a teacher are equipped with important building blocks for the language, literacy and social skills that will be important later in their education. Those who start school behind have a hard time catching up.
11) Homelessness among students has spiked dramatically

Homelessness can range from unsheltered living in cars or abandoned buildings to a combination of hotel and shelter transitions, but the majority of homeless students in Colorado fall into the “doubled-up” category. In other words, their families are sharing housing with other families due to economic hardship or loss of their own housing. Although being doubled-up may be less dire than being completely unsheltered, research has found that when children are living in overcrowded housing situations, their academic performance suffers.
12) Dropout rates vary by race

Having a high school degree goes a long way to keep Coloradans out of poverty. In 2013, 25 percent of those without a high school diploma lived below the poverty level, while only 13 percent of high school graduates were impoverished.
There's much more in the full report.
This story is part of our ongoing exploration of Colorado kids who are living in poverty, how it affects their lives and our common future. We'd like to hear your ideas about about what can be done about child poverty in Colorado. Share your thoughts through our Public Insight Network.